ADNOC Value Chain
ADNOC Value Chain
Opportunity
Opportunity
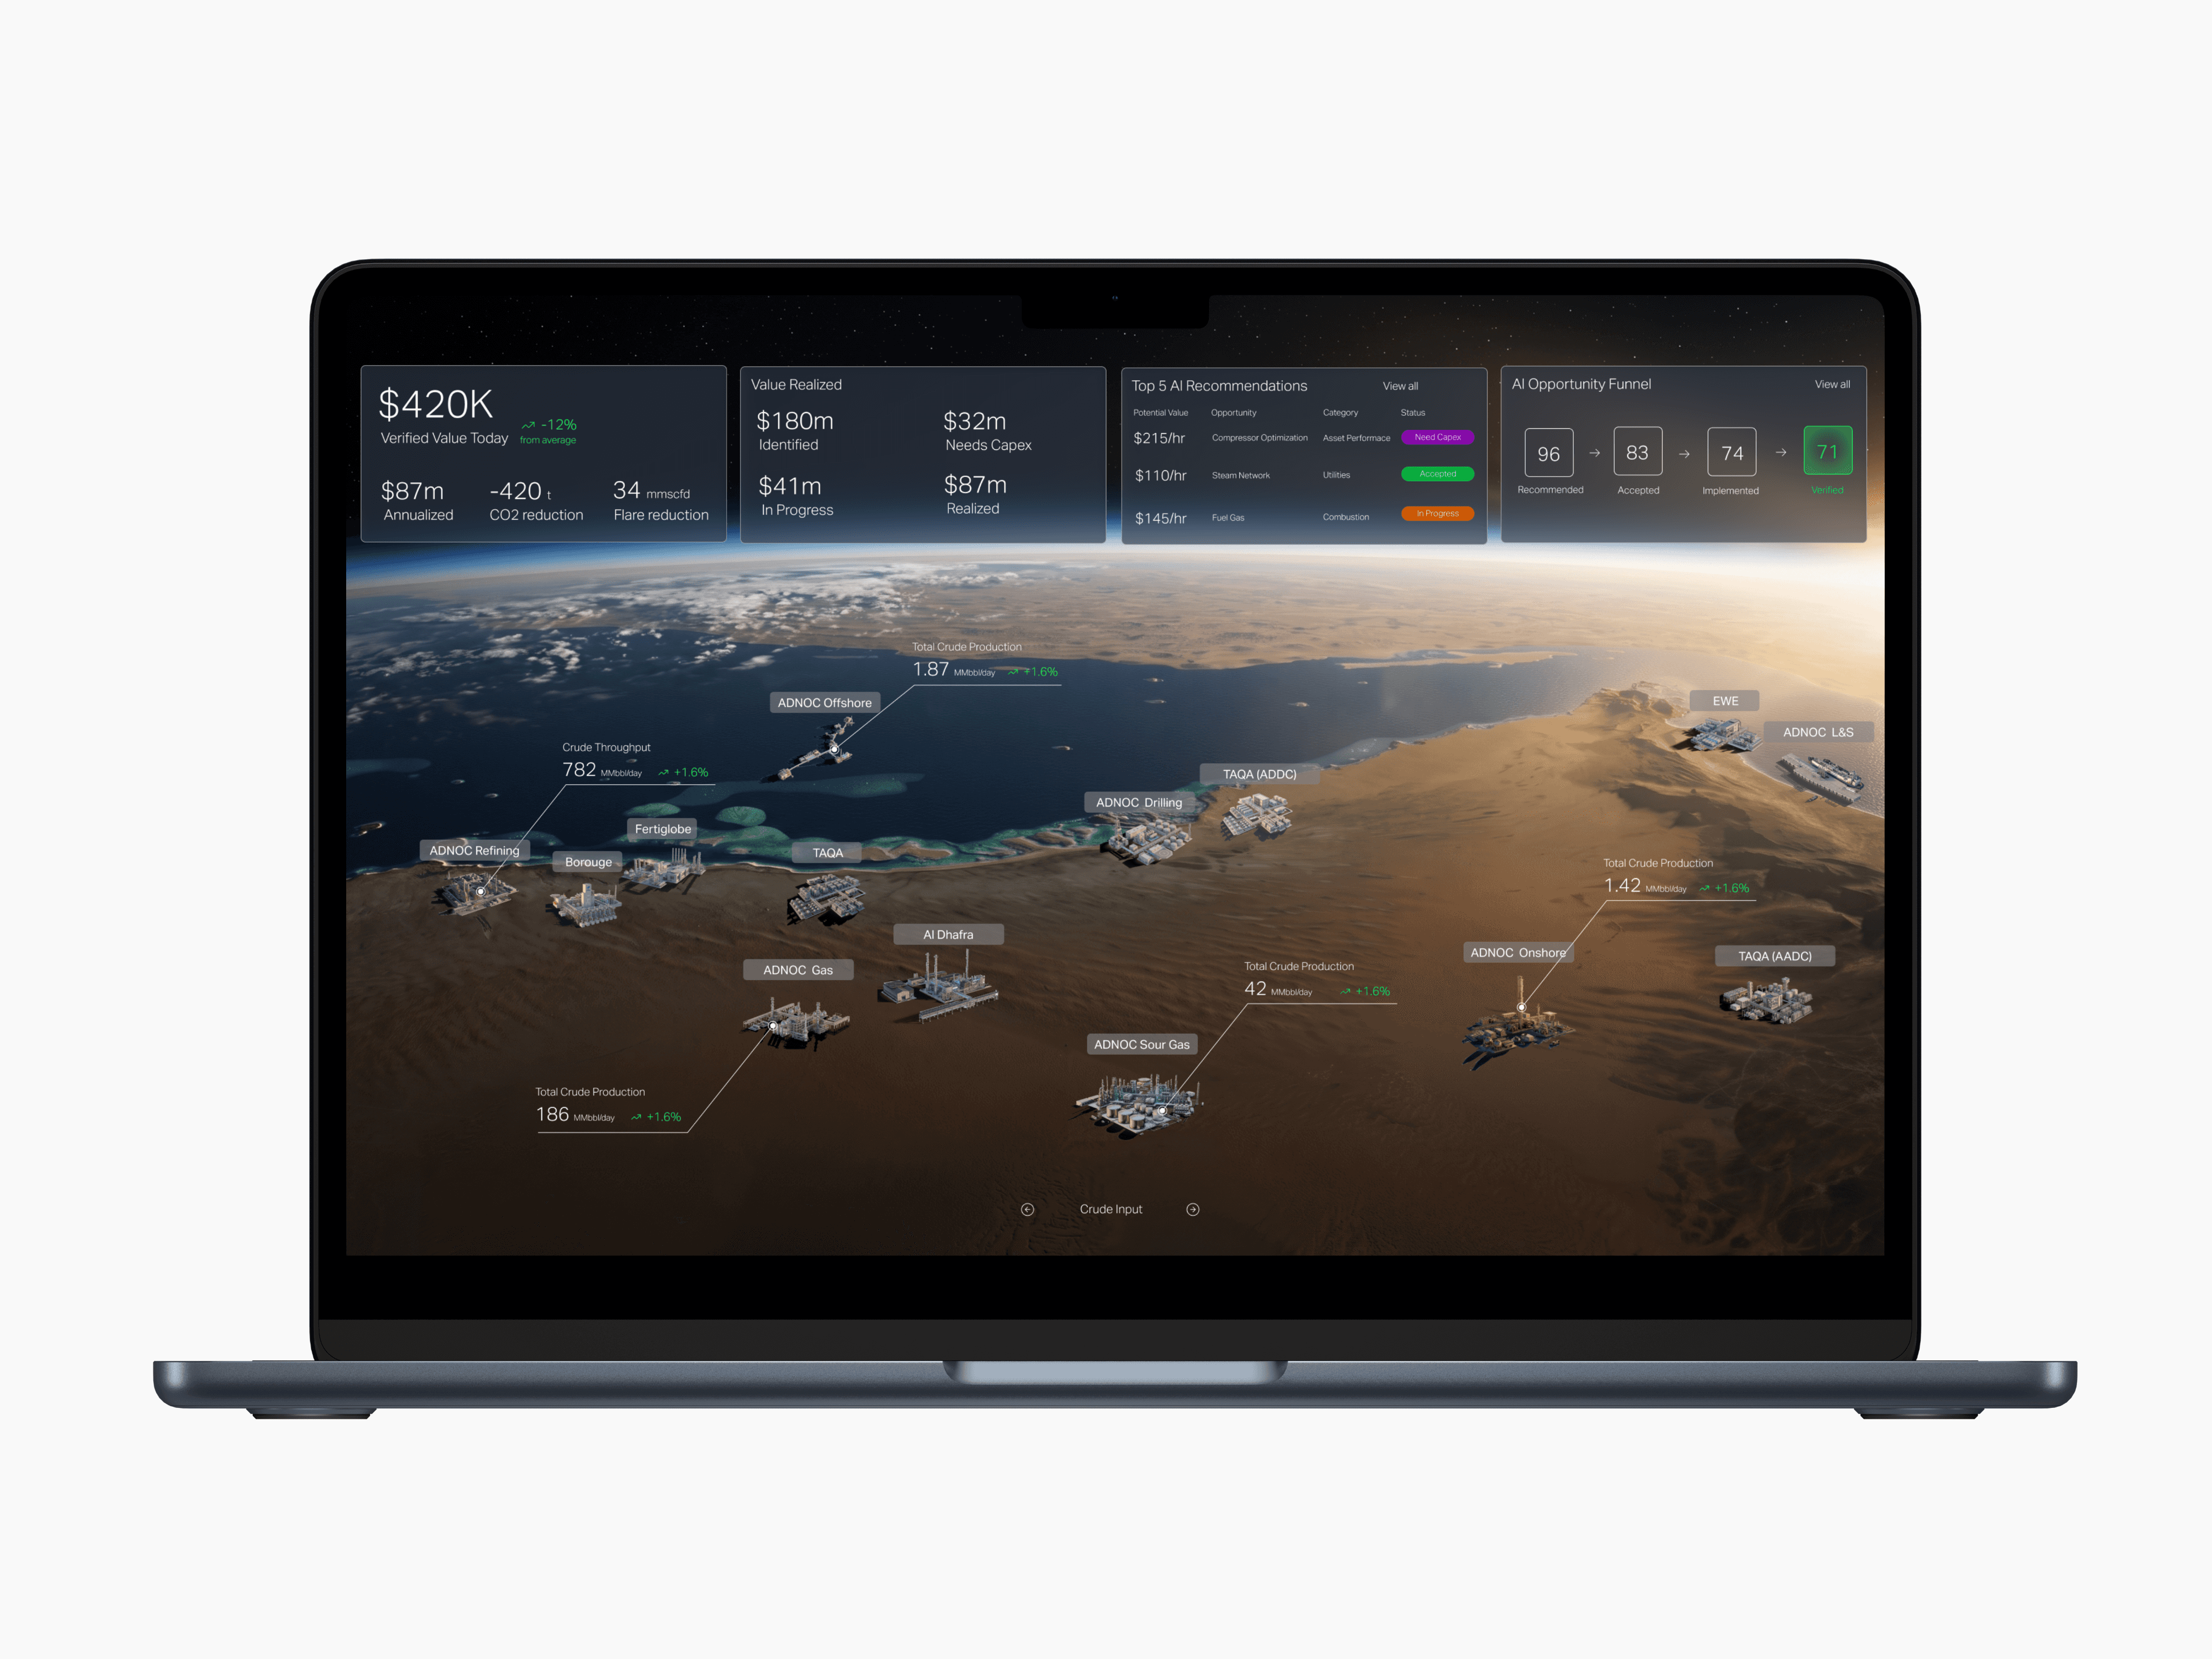
Many dashboards struggle with information overload, often bombarding users with information that may be complex or irrelevant. The ask was to create an immersive experience that showcased high level information for the Group CEO and other executives. Much of the data had to be detailing value potential, product input and output values. The goal was to create an immersive journey that helped sift data based on user requirements.
Many dashboards struggle with information overload, often bombarding users with information that may be complex or irrelevant. The ask was to create an immersive experience that showcased high level information for the Group CEO and other executives. Much of the data had to be detailing value potential, product input and output values. The goal was to create an immersive journey that helped sift data based on user requirements.
Prototyping
Prototyping
The main requirement was finding ways to visualize data. Simplifying the presentation of data points were the easiest, especially in presenting numerical values as is rather than presenting them through different visualizations. Moreover each OPPCO had multiple data points that needed to be easily seen from the get go. Below is the initial prototype, which lack cohesiveness and a holistic view of all data.
The main requirement was finding ways to visualize data. Simplifying the presentation of data points were the easiest, especially in presenting numerical values as is rather than presenting them through different visualizations. Moreover each OPPCO had multiple data points that needed to be easily seen from the get go. Below is the initial prototype, which lack cohesiveness and a holistic view of all data.
Impact
Impact
This interface is currently in development, and has been handed off to the dev team, for implementation .
This interface is currently in development, and has been handed off to the dev team, for implementation .
Immersive experiences
Transformative data visuals
Immersive experiences
Transformative data visuals
Below shows the initial representation of what each OPPCO would look like with pertaining data. Not all individual companies under ADNOC had similar production and loss values, with some having more. As such the below design was not suitable for other companies. We needed something that would make sense to look at.
Below shows the initial representation of what each OPPCO would look like with pertaining data. Not all individual companies under ADNOC had similar production and loss values, with some having more. As such the below design was not suitable for other companies. We needed something that would make sense to look at.
Reimagining data visualization strategies
Reimagining data visualization strategies
Based on shared feedback and discussion, one of our developers suggested grouping the information based on types of production, such as gas, water, crude oil and grouping sustainability metrics together. Moreover we could make a scrollable carousel that shows all metrics as the user interacts with the design. Below are examples of what the screens look like:
Based on shared feedback and discussion, one of our developers suggested grouping the information based on types of production, such as gas, water, crude oil and grouping sustainability metrics together. Moreover we could make a scrollable carousel that shows all metrics as the user interacts with the design. Below are examples of what the screens look like:
I led the user experience interface for the value chain dashboard, which outlined the overall product output of each group company under ADNOC
I led the user experience interface for the value chain dashboard, which outlined the overall product output of each group company under ADNOC
Skills
Product Design
Stakeholder management
Interactive prototyping
User research and testing
Skills
Product Design
Stakeholder management
Interactive prototyping
User research and testing
Role
Design lead
Role
Design lead
Timeline
Q3 2026 - Q4 2026
Timeline
Q3 2026 - Q4 2026
Creating experiential visualizations with established storylines
Creating experiential visualizations with established storylines